
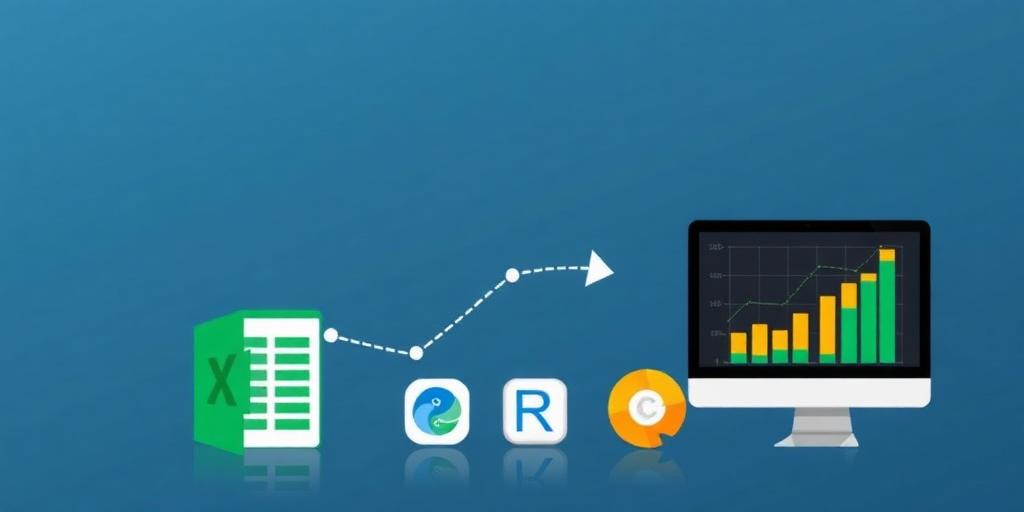
Transitioning from Excel to Advanced Analytics
For years, Microsoft Excel has been the go-to tool for data analysis in many organizations. Its user-friendly interface and versatility have made it a staple for basic data manipulation, reporting, and visualization. However, as businesses grow and data becomes more complex, the limitations of Excel become increasingly apparent. Transitioning to advanced analytics tools and techniques is no longer just an option but a necessity for staying competitive and gaining deeper insights.
The Limitations of Excel
While Excel is excellent for simple tasks, it falls short when dealing with large datasets, complex analyses, and the need for scalable solutions. Some key limitations include:
- Data Size: Excel has row and column limits, making it unsuitable for very large datasets.
- Performance: Processing large datasets can be slow and resource-intensive.
- Complex Analysis: Advanced statistical analysis, machine learning, and predictive modeling are difficult to perform.
- Collaboration: Excel files can be challenging to manage and collaborate on, especially with multiple users.
- Automation: Automating repetitive tasks can be cumbersome and error-prone.
Why Transition to Advanced Analytics?
Advanced analytics offers capabilities that go far beyond what Excel can provide. By leveraging tools like Python, R, and platforms like Tableau or Power BI, organizations can:
- Handle Big Data: Process and analyze massive datasets efficiently.
- Perform Complex Analysis: Conduct sophisticated statistical analysis, machine learning, and predictive modeling.
- Create Scalable Solutions: Develop robust and scalable analytics solutions.
- Improve Collaboration: Utilize version control, collaborative coding environments, and centralized data repositories.
- Automate Processes: Automate data cleaning, analysis, and reporting tasks.
Key Steps for Transitioning
- Assess Your Needs: Identify the specific analytical challenges your organization faces and the capabilities you need to address them.
- Choose the Right Tools: Select tools that align with your needs and budget. Python and R are popular choices for data analysis and machine learning, while Tableau and Power BI are excellent for data visualization.
- Invest in Training: Provide training for your team to ensure they have the skills to use the new tools effectively. Consider online courses, workshops, and internal training programs.
- Start Small: Begin with small, manageable projects to gain experience and build confidence. Gradually increase the complexity of your projects as your team becomes more proficient.
- Build a Data Culture: Foster a data-driven culture within your organization by promoting data literacy, encouraging experimentation, and celebrating successes.
Popular Advanced Analytics Tools
- Python: A versatile programming language with powerful libraries like Pandas, NumPy, and Scikit-learn for data analysis and machine learning.
- R: A programming language specifically designed for statistical analysis and data visualization.
- Tableau: A data visualization tool that allows users to create interactive dashboards and reports.
- Power BI: A business analytics tool from Microsoft that offers data visualization and reporting capabilities.
- SQL: A standard language for managing and querying databases.
Conclusion
Transitioning from Excel to advanced analytics is a strategic move that can unlock significant value for organizations. By embracing new tools and techniques, businesses can gain deeper insights, make better decisions, and stay ahead of the competition. While the transition may require an initial investment in training and resources, the long-term benefits are well worth the effort. Embrace the power of advanced analytics and transform your data into actionable intelligence.


